
개요
지난번 글에서 이어져서, 튜닝을 직접 해보는 글입니다.
https://seung.tistory.com/entry/GoLang-Garbage-Collector-%EA%B0%9C%EB%85%90
[GoLang] Garbage Collector 개념
GC, Garbage Collector Garbage Collector(GC)은 프로그램 실행 중 사용되지 않는 메모리를 자동으로 회수하는 메모리 관리 기법이다.이를 통해 개발자는 명시적으로 메모리를 해제할 필요 없이, 안전하고
seung.tistory.com
저번 글에서 GC, CMS, STW, GC의 청소 대상, TCMalloc 등을 알아보았는데
GC 튜닝은 메모리 사용량, CPU 사용량 그리고 STW(Stop-The-World) 시간 사이의 trade-off(절충)을 하는 작업입니다.
여기저기 고치면서 현재 환경에서 더 나은 퍼포먼스를 보여주는 값을 찾는거죠
예를 들자면
- 메모리 여유가 많을 경우
- GC 임계값을 높여서 더 많은 힙 메모리를 허용해서 GC 실행빈도를 줄여서
- 그 결과로 CPU 오버헤드와 STW 시간을 줄여 응답속도를 개선할 수 있습니다.
- 메모리 제약이 심한 경우
- GC 임계값을 낮춰 더 자주 GC를 수행하여 힙 메모리의 사용량을 줄일 수 있습니다.
- 다만, 이럴 경우 STW 시간이 늘어나거나, CPU 사용량이 증가합니다.
즉 GC 튜닝은 애플리케이션의 특성과 실행환경에 맞춰 최적의 균형점을 찾는 게 목적으로 정답이 있는 게 아닙니다.
여기서는 튜닝을 하기 위해서 볼 수 있는 여러 지표에 대해 알아봅시다.
간단하게 기존 프로젝트에서 맛보려면 다음 방법도 좋습니다.
import (
	...
	_ "net/http/pprof"
)


func main() {

	go func() {
		http.ListenAndServe("0.0.0.0:6060", nil)
	}()

    ...
}
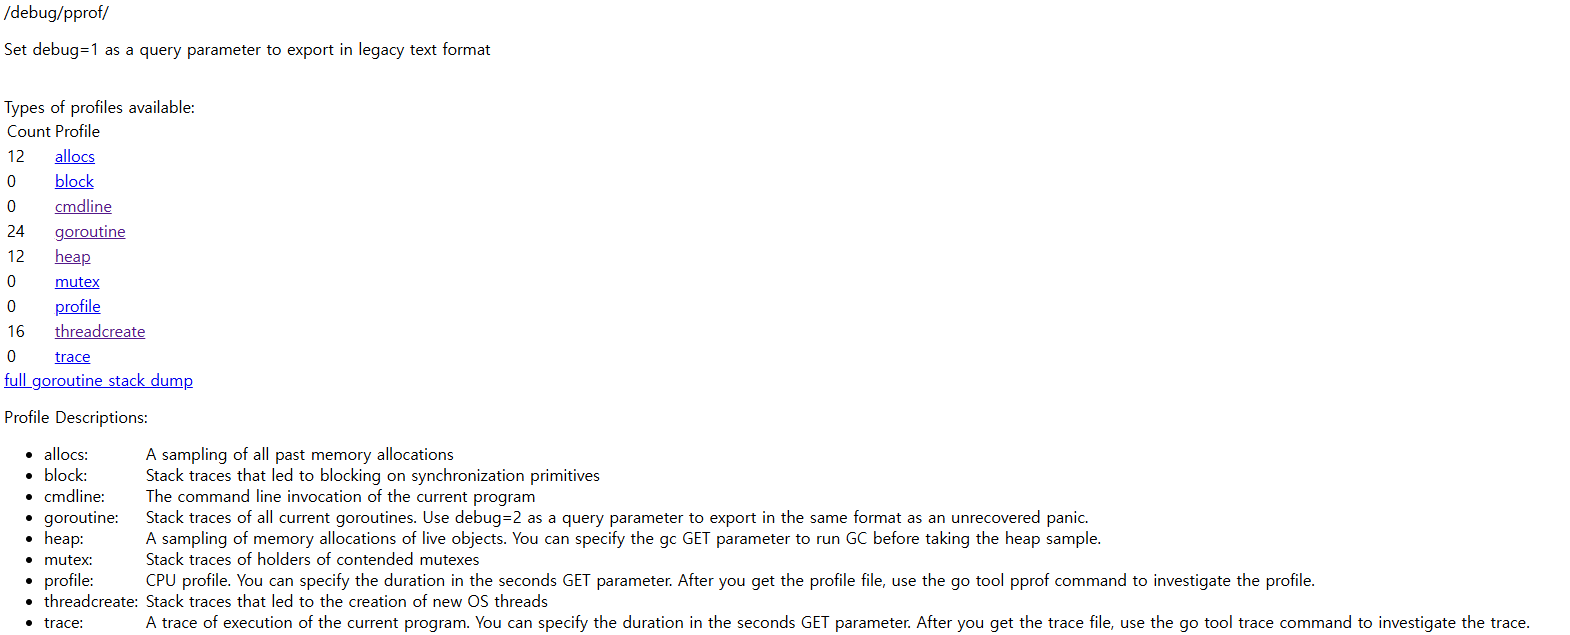
pprof.go에서 다음과 같이 라우팅을 설정해주는데
func init() {
	http.HandleFunc("/debug/pprof/", Index)
	http.HandleFunc("/debug/pprof/cmdline", Cmdline)
	http.HandleFunc("/debug/pprof/profile", Profile)
	http.HandleFunc("/debug/pprof/symbol", Symbol)
	http.HandleFunc("/debug/pprof/trace", Trace)
}
다음처럼 간편하게 확인할 수 있습니다.
시각화 하기위해서는 위 서번는 별도로 두고 아래 명령어로 볼 수 있습니다, 그러기 위해선 아래에 있는 graphviz가 필요하죠
go tool pprof -http 0.0.0.0:8088 http://0.0.0.0:6060/debug/pprof/heap
go tool pprof -http 0.0.0.0:8088 http://0.0.0.0:6060/debug/pprof/goroutine
추가적인 명령어는 이 사이트가 정리를 잘했더군요
https://pangyoalto.com/go-using-pprof-for-profiing/
[Go] pprof를 사용해 profiling을 해보자(부제: 당신은 서버 이상 원인을 어떻게 찾으시나요?)
[요약] 1. pprof는 go 어플리케이션을 profiling 해주는 도구이다. 2. go는 go tool에서 pprof를 기본적으로 지원해주기 때문에 쉽게 pprof를 이용할 수 있다. 3. graphviz를 통해 분석을 시각화해서 볼 수 있다.
pangyoalto.com
Profiling
위 방법은 편리하지만, 원하는 로직 부분에 적용하려면 이 방법을 쓰는게 좋습니다.
Go에서 profiling을 해주는 도구로 pprof를 쓸 수 있습니다, go tool에서 기본적으로 지원하며 이걸 주로 사용합니다.
https://github.com/google/pprof?ref=pangyoalto.com
GitHub - google/pprof: pprof is a tool for visualization and analysis of profiling data
pprof is a tool for visualization and analysis of profiling data - google/pprof
github.com
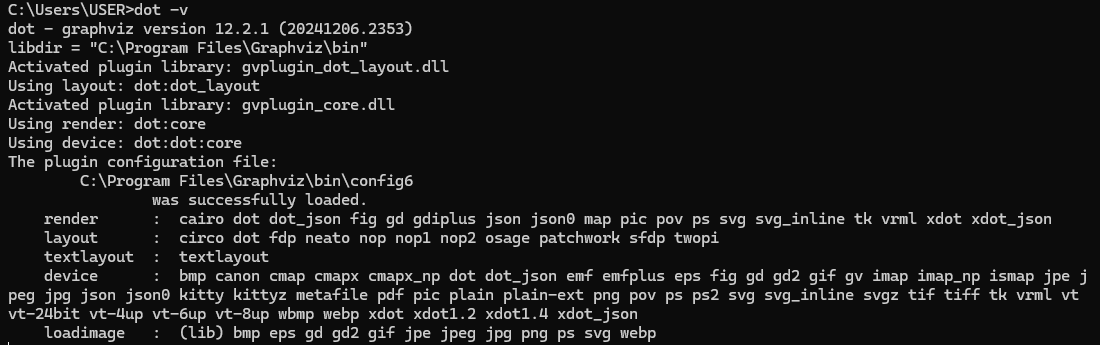
프로파일링 데이터를 시각화할 때 Graphviz를 필요로 하기에, 설치 및 시스템 환경변수 등록을 합니다.
Graphviz
Please join the Graphviz forum to ask questions and discuss Graphviz. What is Graphviz? Graphviz is open source graph visualization software. Graph visualization is a way of representing structural information as diagrams of abstract graphs and networks. I
graphviz.org
C:\Program Files\Graphviz\bin
환경변수 등록이 완료되었다면 다음처럼 dot -v 명령어로 정상적으로 실행되는 걸 확인할 수 있죠
Pprof Smaple
아래 샘플을 만들며 pprof 도구에 사용법을 정리해 봅시다.
파일을 읽어서 메모리를 차지하는 코드이며 한번 읽고 열 번 읽고 고루틴으로 백번 읽는 코드입니다.
main.go
package main

import (
	"io"
	"log"
	"pprof.com/fd"
	"sync"
)

// TestApp은 파일 디스크립터 관리를 담당하는 구조체
type TestApp struct {
	files []io.ReadCloser // 열려 있는 파일 리스트
}

// 모든 열린 파일을 닫고, 리스트를 초기화하여 FD 누수를 방지
func (a *TestApp) Close() {
	for _, cl := range a.files {
		_ = cl.Close()
	}
	a.files = a.files[:0] // 파일 디스크립터 절약
}

// 파일을 열고 TestApp에 추가 (pprof 프로파일링 포함)
func (a *TestApp) open(name string) {
	f, err := fd.Open(name) // pprof 프로파일링 포함
	if err != nil {
		log.Printf("File Not Found : %v", err)
		return // 에러 발생 시 추가하지 않음
	}
	a.files = append(a.files, f)
}

// 단일 파일 열기
func (a *TestApp) OpenSingleFile(name string) {
	a.open(name)
}

// 동일한 파일을 10개 연속으로 열기 (테스트용)
func (a *TestApp) OpenTenFiles(name string) {
	for i := 0; i < 10; i++ {
		a.open(name)
	}
}

// 파일을 100개 동시(고루틴)로 열기 (멀티스레드 테스트)
func (a *TestApp) Open100FilesConcurrently(name string) {
	wg := sync.WaitGroup{}
	wg.Add(10) // 10개의 고루틴 실행
	for i := 0; i < 10; i++ {
		go func() {
			a.OpenTenFiles(name) // 각 고루틴이 10개씩 파일을 엶
			wg.Done()
		}()
	}
	wg.Wait() // 모든 고루틴이 끝날 때까지 대기
}

func main() {
	a := &TestApp{}
	defer a.Close() // 실행 종료 시 모든 열린 파일 닫기

	testFilePath := "./test.txt"

	// 프로파일링을 위해 반복적인 파일 열기 및 닫기
	for i := 0; i < 10; i++ {
		a.OpenTenFiles(testFilePath)
		a.Close() // 닫기 호출하여 FD 누수 방지
	}

	// pprof 분석을 위해 실제로 열릴 파일
	f, _ := fd.Open(testFilePath)
	a.files = append(a.files, f)

	// 다양한 파일 열기 시나리오 실행
	a.OpenSingleFile(testFilePath)
	a.OpenTenFiles(testFilePath)
	a.Open100FilesConcurrently(testFilePath)

	// 현재 파일 디스크립터 사용 내역을 pprof 파일로 저장
	if err := fd.Write("fd.pprof"); err != nil {
		log.Fatal(err)
	}
}fd/fileDescriptor.go
package fd

import (
	"os"
	"runtime/pprof"
)

// `pprof.NewProfile("fd.inuse")`
// - 이 프로파일은 현재 사용 중인 파일 디스크립터(FD) 개수를 추적하는 용도로 사용됨
// - `pprof.Lookup("fd.inuse")`로 다른 패키지에서도 조회 가능
// - 전역 변수로 설정하면 특정 파일에서만 사용하기 어려우므로 일반적으로는 지양함
var fdProfile = pprof.NewProfile("fd.inuse")

// File 구조체는 os.File을 래핑하여 pprof와 연동되도록 설계됨
type File struct {
	*os.File
}

// 파일을 열고 프로파일링에 추가하는 함수
func Open(name string) (*File, error) {
	f, err := os.Open(name)
	if err != nil {
		return nil, err
	}
	// `Add(f, 2)`에서 2는 스택 프레임을 몇 개 건너뛸지를 결정함
	// 1: Open() 자신
	// 2: Open()을 호출한 상위 함수
	// 프로파일러에 Open 상위 함수를 기록하기 위한 용도
	fdProfile.Add(f, 2)
	return &File{File: f}, nil
}

// 파일을 닫을 때 pprof 프로파일에서 제거하는 함수
func (f *File) Close() error {
	// 추적하던 파일이 닫히는 순간, 프로파일에서 제거
	defer fdProfile.Remove(f.File)
	return f.File.Close()
}

// 현재 열려 있는 파일 디스크립터 목록을 pprof 파일로 저장하는 함수
func Write(profileOutPath string) error {
	out, err := os.Create(profileOutPath)
	if err != nil {
		return err
	}
	defer out.Close()

	// 현재 pprof 프로파일 기록 (0: 기본 출력 레벨)
	if err := fdProfile.WriteTo(out, 0); err != nil {
		return err
	}
	return nil
}그리고 프로젝트 루트 단 아래에 test.txt를 추가합니다.
다음 명령어로 cli에서도 실행이 가능합니다
go tool pprof fd.pprof위 명령어로, cli에 접속하면 아래 명령어 등을 입력할 수 있게 됩니다.
아래 명령어를 통해 cmd로 보면 눈이 다소 피로하므로
- top : 가장 많은 연산을 차지한 함수 확인
- list main.main : 특정 함수별 실행 정보 확인
- web : 호출 그래프 시각화 (Graphviz 필요)
처음부터 브라우저에서 시각화를 통해 확인하는 게 가능하므로 그걸 기준으로 사용법을 보죠
코드를 통해 생성한 fd.pprof를 실행합니다.
go tool pprof -http=:8080 fd.pprof
이제 http://localhost:8080/ui/로 접속하면 아래 이미지처럼 볼 수 있습니다.
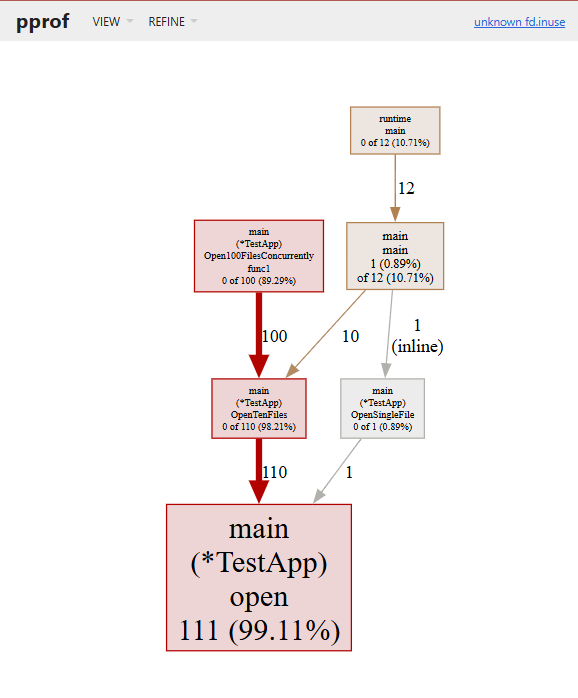
위 기본 그래프 페이지로 알 수 있는 건 아래와 같습니다.
| 노드의 크기 | 크기가 클 수록 직접 사용된 빈도가 높다는 걸로, 시스템의 자원이나 사용 시간을 많이 사용 |
| 노드 테두리 및 색상 | 사용 빈도로, 일반적으로 금색이지만 사용될 수록 빨갛게 표현되고, 사용 값이 0에 가깝다면 회색 |
| 엣지 | 노드와 마찬가지로 색상과 두께로 사용빈도를 나타내고, 추가로 가중치도 표현 |
| 점선 엣지 | pprof로 보여줄 수 있는 노드의 제한은 가독성을 위해 80개로 되어있는데, 안보이는 걸 점선으로 표시 |
이런 정보들로 위 코드에서 main이 아닌 새로운 고루틴을 통해 실행된 Open100FilesConcurrently가 누적사용량이 제일 많고, 가장 파일을 가장 많이 개방한 건 Open 함수인걸 알 수 있습니다.
View 모드를 Top으로 하여 아래와 같이 한눈에 볼 수도 있죠
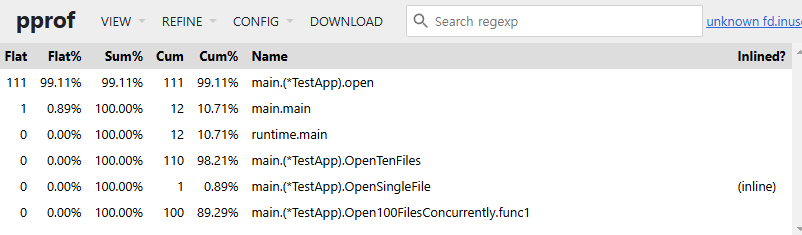
Flame Graph로 하면 직사각형으로 백분율 하여 볼 수 있고, 클릭해서 정확한 퍼센티지도 알 수 있
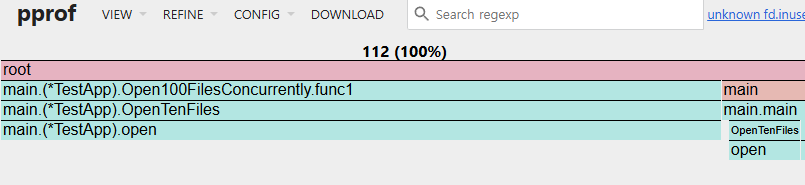
이 외에도 Peek, Source, Disassembel 모드로 직접적인 코드를 보면서 자원 사용량도 알 수 있습니다.
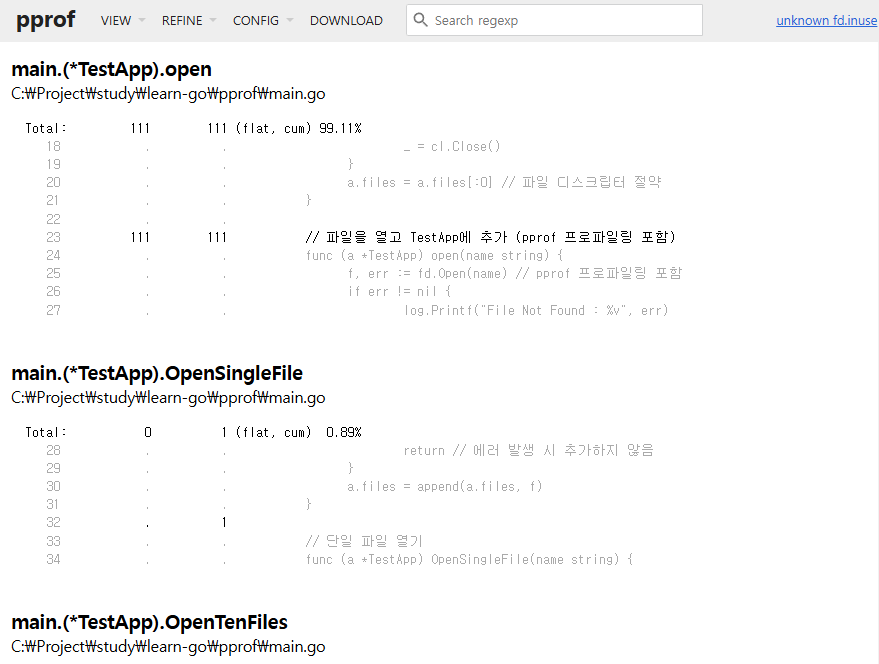
여기까지만 보면 GC를 수정함으로써 가장 달라지는 부분은 파일 디스크립터 사용이 많아지면서 메모리를 많이 차지하는 부분이 가장 영향을 많이 받게 되는데, 아래 세 곳이 가장 영향이 많이 받는다고 생각할 수 있습니다.
| Open100FilesConcurrently | 실행 직후로, 이 함수가 실행되면 짧은 시간 동안 FD가 급증했다가 닫히고 이 시점에서 GC를 실행하면 힙 메모리를 정리할 수 있음 |
| OpenTenFiles | 내부에서 일정 개수 이상일 때 GC를 실행으로 CPU 부담은 적어지지만 GC가 자주 발생되어 성능 저하가 발생할 수 있음 |
| TestApp의 close | FD 해제 후 GC를 실행하면 정리 효과는 극대화되지만 불필요한 GC 실행이 많아짐 |
이 중에 처음에 나온 Open100FilesConcurrently 실행 직후에 GC를 실행시킨다면 아래처럼 수정할 수도 있네요
// 파일을 100개 동시(고루틴)로 열기 (멀티스레드 테스트)
func (a *TestApp) Open100FilesConcurrently(name string) {
	wg := sync.WaitGroup{}
	wg.Add(10) // 10개의 고루틴 실행
	for i := 0; i < 10; i++ {
		go func() {
			a.OpenTenFiles(name) // 각 고루틴이 10개씩 파일을 엶
			wg.Done()
		}()
	}
	wg.Wait() // 모든 고루틴이 끝날 때까지 대기
	runtime.GC()
}
Heap Memory
위 코드를 profiling 하면서 무슨 부분이 크게 메모리를 잡아먹는지는 다른 함수들과 상대비교로 하면서 튜닝할 수 있는 포인트는 알 수 있었습니다.
하지만 GC 튜닝을 적용하기에는 좀 추상적인 지표로 느껴집니다.
찾아낸 부분에서 어떻게 객체가 메모리에 할당이 되는지를 알아야 전체적으로 GC가 필요한 객체를 줄이고 튜닝할 수 있는 거죠.
이때 알면 좋은 게 환경변수 gctrace와 컴파일러 빌드 옵션인 gcflags 등이 있습니다.
GODEBUG=gctrace
간단하게 Go에서는 환경변수를 변경하는 걸로 GC 관련 로그들을 출력할 수 있습니다
로그에는 GC 주기, 힙 메모리 크기 변화, pause 시간등을 포함하게 됩니다.
이걸로 아래 사항들을 참조할 수 있죠
- 실시간 모니터링 : 런타임에 GC가 실행될 때마다 쉽게 확인이 되며, GC 튜닝에 중요한 정보를 제공해 줌
- 문제 진단 : GC 동작 패턴을 파악하며 메모리 사용 최적화 또는 STW 시간을 최소화하는데 도움을 줌
gctrace=1은 아래와 같이 나오는데, 단일 행으로 메모리 양과 일시 중지 길이를 요약합니다.
export GODEBUG=gctrace=1
go run main.go
----------------------------------------
gc 1 @0.058s 0%: 0+0.51+0 ms clock, 0+0/0/0+0 ms cpu, 3->4->1 MB, 4 MB goal, 0 MB stacks, 0 MB globals, 24 P
gc 2 @0.060s 0%: 0+0.51+0 ms clock, 0+0/0/0+0 ms cpu, 3->4->1 MB, 4 MB goal, 0 MB stacks, 0 MB globals, 24 P
gc 3 @0.061s 0%: 0+0.51+0 ms clock, 0+0/1.0/0+0 ms cpu, 3->4->1 MB, 4 MB goal, 0 MB stacks, 0 MB globals, 24 P
gc 4 @0.063s 0%: 0+0.51+0 ms clock, 0+0/2.0/0+0 ms cpu, 3->4->1 MB, 4 MB goal, 0 MB stacks, 0 MB globals, 24 P
gc 5 @0.064s 0%: 0+0+0 ms clock, 0+0/0/0+0 ms cpu, 3->3->1 MB, 4 MB goal, 0 MB stacks, 0 MB globals, 24 P
gc 6 @0.065s 0%: 0+0.51+0 ms clock, 0+1.0/1.0/0+0 ms cpu, 3->4->1 MB, 4 MB goal, 0 MB stacks, 0 MB globals, 24 P
gc 7 @0.066s 0%: 0+0.52+0 ms clock, 0+0/0/0+0 ms cpu, 3->4->1 MB, 4 MB goal, 0 MB stacks, 0 MB globals, 24 P
gc 8 @0.067s 0%: 0+0.51+0 ms clock, 0+0/2.5/0.51+0 ms cpu, 3->5->1 MB, 4 MB goal, 0 MB stacks, 0 MB globals, 24 P
...
gctrace=2로 할 경우 더 상세하게 gc 단계별 (마크, 스윕) 소요 시간과 구체적인 메모리 사용 통계를 볼 수 있습니다.
하지만 이 예제에서는 동일하게 출력이 되므로 패스를 하고
이 로그를 보는 법은 go 문서에서도 잘 나와있는데 아래와 같습니다.
gc # @#s #%: #+...+# ms clock, #+...+# ms cpu, #->#-># MB, # MB goal, # P

gc #        the GC number, incremented at each GC
@#s         time in seconds since program start
#%          percentage of time spent in GC since program start
#+...+#     wall-clock/CPU times for the phases of the GC
#->#-># MB  heap size at GC start, at GC end, and live heap
# MB goal   goal heap size
# P         number of processors used
마지막으로 gcpacertrace=1로 더 자세한 GC, Concurrent Pacer의 정보도 알 수 있죠.
export GODEBUG=gctrace=1,gcpacertrace=1
go run main.go
--------------------------------------------------------
pacer: assist ratio=+3.303079e+000 (scan 0 MB in 3->4 MB) workers=6++0.000000e+000
pacer: 25% CPU (25 exp.) for 534296+41640+460000 B work (460000 B exp.) in 4055040 B -> 4677632 B (∆goal 483328, cons/mark +0.000000e+000)
gc 1 @0.054s 0%: 0+1.0+0 ms clock, 0+0/0/0+0 ms cpu, 3->4->1 MB, 4 MB goal, 0 MB stacks, 0 MB globals, 24 P
pacer: assist ratio=+1.896859e+000 (scan 0 MB in 3->4 MB) workers=6++0.000000e+000
pacer: 25% CPU (25 exp.) for 643456+43216+460000 B work (1040480 B exp.) in 3645776 B -> 4602016 B (∆goal 407712, cons/mark +2.003316e-001)
gc 2 @0.056s 1%: 0+0+0.99 ms clock, 0+0/0/0+23 ms cpu, 3->4->1 MB, 4 MB goal, 0 MB stacks, 0 MB globals, 24 P
pacer: assist ratio=+1.605905e+000 (scan 0 MB in 3->4 MB) workers=6++0.000000e+000
pacer: 25% CPU (25 exp.) for 570712+46392+460000 B work (1148376 B exp.) in 3479208 B -> 4459488 B (∆goal 265184, cons/mark +2.779755e-001)
gc 3 @0.057s 1%: 0+1.0+0 ms clock, 0+0/2.0/0+0 ms cpu, 3->4->1 MB, 4 MB goal, 0 MB stacks, 0 MB globals, 24 P
pacer: assist ratio=+1.186420e+000 (scan 0 MB in 3->4 MB) workers=6++0.000000e+000
pacer: 25% CPU (25 exp.) for 626008+41424+460000 B work (1079376 B exp.) in 3284528 B -> 4015512 B (∆goal -178792, cons/mark +3.033690e-001)
gc 4 @0.059s 1%: 0+0+0 ms clock, 0+0/0/0+0 ms cpu, 3->3->1 MB, 4 MB goal, 0 MB stacks, 0 MB globals, 24 P
pacer: assist ratio=+1.450420e+000 (scan 0 MB in 3->4 MB) workers=6++0.000000e+000
pacer: 25% CPU (25 exp.) for 676328+33520+460000 B work (1130272 B exp.) in 3415032 B -> 4948368 B (∆goal 754064, cons/mark +3.033690e-001)
gc 5 @0.061s 2%: 0.29+0+0 ms clock, 7.1+0/0/0+0 ms cpu, 3->4->1 MB, 4 MB goal, 0 MB stacks, 0 MB globals, 24 P
pacer: assist ratio=+1.630934e+000 (scan 0 MB in 3->4 MB) workers=6++0.000000e+000
pacer: 25% CPU (25 exp.) for 691064+61168+460000 B work (1172120 B exp.) in 3475624 B -> 4953600 B (∆goal 759296, cons/mark +4.369046e-001)
gc 6 @0.062s 2%: 0+1.0+0 ms clock, 0+0/0/0+0 ms cpu, 3->4->1 MB, 4 MB goal, 0 MB stacks, 0 MB globals, 24 P
하지만 위 방법도 특정 객체로 세분화해서 알기는 쉽지 않죠
완전히 세세한 객체들의 메모리 할당이 어디서 어디로, Stack인지, Heap인지 또는 왜 거기로 갔는지 코드 위치는 어디인지까지 볼 수 있는데 아래 옵션을 통해 알 수 있죠
-gcflags='-m', -gcflags=‘-m -m’
m을 하나만 붙이면 지난 글에서 적었던 Escape Analysis만 알 수 있습니다
하지만 m을 더 붙이면 아래처럼 엄청 자세하게 볼 수 있죠
$ go build -gcflags='-m -m' main.go
# command-line-arguments
./main.go:16:6: can inline (*TestApp).Close with cost 76 as: method(*TestApp) func() { for loop; a.files = a.files[:0] }
./main.go:24:6: cannot inline (*TestApp).open: function too complex: cost 164 exceeds budget 80
./main.go:34:6: can inline (*TestApp).OpenSingleFile with cost 60 as: method(*TestApp) func(string) { (*TestApp).open(a, name) }
./main.go:39:6: can inline (*TestApp).OpenTenFiles with cost 72 as: method(*TestApp) func(string) { for loop }
./main.go:46:6: cannot inline (*TestApp).Open100FilesConcurrently: unhandled op GO
./main.go:50:6: cannot inline (*TestApp).Open100FilesConcurrently.func1: function too complex: cost 138 exceeds budget 80
./main.go:58:6: cannot inline main: unhandled op DEFER
./main.go:60:2: can inline main.deferwrap1 with cost 78 as: func() { (*TestApp).Close(.autotmp_1) }
C:\Users\USER\go\go1.23.4\src\sync\atomic\type.go:63:6: can inline atomic.(*Pointer[go.shape.struct { os.mu sync.Mutex; os.buf *[]uint8; os.bufp int; os.h syscall.Handle; os.vol uint32; os.class uint32; os.path string }]).CompareAndSwap with cost 63 as: method
(*atomic.Pointer[go.shape.struct { os.mu sync.Mutex; os.buf *[]uint8; os.bufp int; os.h syscall.Handle; os.vol uint32; os.class uint32; os.path string }]) func(*[16]uintptr, *go.shape.struct { os.mu sync.Mutex; os.buf *[]uint8; os.bufp int; os.h syscall.Handle
; os.vol uint32; os.class uint32; os.path string }, *go.shape.struct { os.mu sync.Mutex; os.buf *[]uint8; os.bufp int; os.h syscall.Handle; os.vol uint32; os.class uint32; os.path string }) bool { return atomic.CompareAndSwapPointer(&atomic.x.v, unsafe.Pointer(atomic.old), unsafe.Pointer(atomic.new)) }
C:\Users\USER\go\go1.23.4\src\sync\atomic\type.go:60:6: can inline atomic.(*Pointer[go.shape.struct { os.mu sync.Mutex; os.buf *[]uint8; os.bufp int; os.h syscall.Handle; os.vol uint32; os.class uint32; os.path string }]).Swap with cost 62 as: method(*atomic.P
ointer[go.shape.struct { os.mu sync.Mutex; os.buf *[]uint8; os.bufp int; os.h syscall.Handle; os.vol uint32; os.class uint32; os.path string }]) func(*[16]uintptr, *go.shape.struct { os.mu sync.Mutex; os.buf *[]uint8; os.bufp int; os.h syscall.Handle; os.vol u
int32; os.class uint32; os.path string }) *go.shape.struct { os.mu sync.Mutex; os.buf *[]uint8; os.bufp int; os.h syscall.Handle; os.vol uint32; os.class uint32; os.path string } { return (*go.shape.struct { os.mu sync.Mutex; os.buf *[]uint8; os.bufp int; os.h syscall.Handle; os.vol uint32; os.class uint32; os.path string })(atomic.SwapPointer(&atomic.x.v, unsafe.Pointer(atomic.new))) }
C:\Users\USER\go\go1.23.4\src\sync\atomic\type.go:57:6: can inline atomic.(*Pointer[go.shape.struct { os.mu sync.Mutex; os.buf *[]uint8; os.bufp int; os.h syscall.Handle; os.vol uint32; os.class uint32; os.path string }]).Store with cost 61 as: method(*atomic.
Pointer[go.shape.struct { os.mu sync.Mutex; os.buf *[]uint8; os.bufp int; os.h syscall.Handle; os.vol uint32; os.class uint32; os.path string }]) func(*[16]uintptr, *go.shape.struct { os.mu sync.Mutex; os.buf *[]uint8; os.bufp int; os.h syscall.Handle; os.vol uint32; os.class uint32; os.path string }) { atomic.StorePointer(&atomic.x.v, unsafe.Pointer(atomic.val)) }
C:\Users\USER\go\go1.23.4\src\sync\atomic\type.go:54:6: can inline atomic.(*Pointer[go.shape.struct { os.mu sync.Mutex; os.buf *[]uint8; os.bufp int; os.h syscall.Handle; os.vol uint32; os.class uint32; os.path string }]).Load with cost 4 as: method(*atomic.Po
inter[go.shape.struct { os.mu sync.Mutex; os.buf *[]uint8; os.bufp int; os.h syscall.Handle; os.vol uint32; os.class uint32; os.path string }]) func(*[16]uintptr) *go.shape.struct { os.mu sync.Mutex; os.buf *[]uint8; os.bufp int; os.h syscall.Handle; os.vol uint32; os.class uint32; os.path string } { return (*go.shape.struct { os.mu sync.Mutex; os.buf *[]uint8; os.bufp int; os.h syscall.Handle; os.vol uint32; os.class uint32; os.path string })(atomic.LoadPointer(&atomic.x.v)) }
C:\Users\USER\go\go1.23.4\src\sync\atomic\type.go:63:6: can inline atomic.(*Pointer[os.dirInfo]).CompareAndSwap with cost 70 as: method(*atomic.Pointer[os.dirInfo]) func(*os.dirInfo, *os.dirInfo) bool { return (*atomic.Pointer[go.shape.struct { os.mu sync.Mutex; os.buf *[]uint8; os.bufp int; os.h syscall.Handle; os.vol uint32; os.class uint32; os.path string }]).CompareAndSwap(atomic.x, &atomic..dict.Pointer[os.dirInfo], atomic.old, atomic.new) }
C:\Users\USER\go\go1.23.4\src\sync\atomic\type.go:60:6: can inline atomic.(*Pointer[os.dirInfo]).Swap with cost 68 as: method(*atomic.Pointer[os.dirInfo]) func(*os.dirInfo) *os.dirInfo { return (*atomic.Pointer[go.shape.struct { os.mu sync.Mutex; os.buf *[]uint8; os.bufp int; os.h syscall.Handle; os.vol uint32; os.class uint32; os.path string }]).Swap(atomic.x, &atomic..dict.Pointer[os.dirInfo], atomic.new) }
C:\Users\USER\go\go1.23.4\src\sync\atomic\type.go:57:6: can inline atomic.(*Pointer[os.dirInfo]).Store with cost 66 as: method(*atomic.Pointer[os.dirInfo]) func(*os.dirInfo) { (*atomic.Pointer[go.shape.struct { os.mu sync.Mutex; os.buf *[]uint8; os.bufp int; os.h syscall.Handle; os.vol uint32; os.class uint32; os.path string }]).Store(atomic.x, &atomic..dict.Pointer[os.dirInfo], atomic.val) }$ go build -gcflags='-m -m' main.go
# command-line-arguments
./main.go:16:6: can inline (*TestApp).Close with cost 76 as: method(*TestApp) func() { for loop; a.files = a.files[:0] }
./main.go:24:6: cannot inline (*TestApp).open: function too complex: cost 164 exceeds budget 80
./main.go:34:6: can inline (*TestApp).OpenSingleFile with cost 60 as: method(*TestApp) func(string) { (*TestApp).open(a, name) }
./main.go:39:6: can inline (*TestApp).OpenTenFiles with cost 72 as: method(*TestApp) func(string) { for loop }
./main.go:46:6: cannot inline (*TestApp).Open100FilesConcurrently: unhandled op GO
./main.go:50:6: cannot inline (*TestApp).Open100FilesConcurrently.func1: function too complex: cost 138 exceeds budget 80
./main.go:58:6: cannot inline main: unhandled op DEFER
./main.go:60:2: can inline main.deferwrap1 with cost 78 as: func() { (*TestApp).Close(.autotmp_1) }
C:\Users\USER\go\go1.23.4\src\sync\atomic\type.go:63:6: can inline atomic.(*Pointer[go.shape.struct { os.mu sync.Mutex; os.buf *[]uint8; os.bufp int; os.h syscall.Handle; os.vol uint32; os.class uint32; os.path string }]).CompareAndSwap with cost 63 as: method
(*atomic.Pointer[go.shape.struct { os.mu sync.Mutex; os.buf *[]uint8; os.bufp int; os.h syscall.Handle; os.vol uint32; os.class uint32; os.path string }]) func(*[16]uintptr, *go.shape.struct { os.mu sync.Mutex; os.buf *[]uint8; os.bufp int; os.h syscall.Handle
; os.vol uint32; os.class uint32; os.path string }, *go.shape.struct { os.mu sync.Mutex; os.buf *[]uint8; os.bufp int; os.h syscall.Handle; os.vol uint32; os.class uint32; os.path string }) bool { return atomic.CompareAndSwapPointer(&atomic.x.v, unsafe.Pointer(atomic.old), unsafe.Pointer(atomic.new)) }
C:\Users\USER\go\go1.23.4\src\sync\atomic\type.go:60:6: can inline atomic.(*Pointer[go.shape.struct { os.mu sync.Mutex; os.buf *[]uint8; os.bufp int; os.h syscall.Handle; os.vol uint32; os.class uint32; os.path string }]).Swap with cost 62 as: method(*atomic.P
ointer[go.shape.struct { os.mu sync.Mutex; os.buf *[]uint8; os.bufp int; os.h syscall.Handle; os.vol uint32; os.class uint32; os.path string }]) func(*[16]uintptr, *go.shape.struct { os.mu sync.Mutex; os.buf *[]uint8; os.bufp int; os.h syscall.Handle; os.vol u
int32; os.class uint32; os.path string }) *go.shape.struct { os.mu sync.Mutex; os.buf *[]uint8; os.bufp int; os.h syscall.Handle; os.vol uint32; os.class uint32; os.path string } { return (*go.shape.struct { os.mu sync.Mutex; os.buf *[]uint8; os.bufp int; os.h syscall.Handle; os.vol uint32; os.class uint32; os.path string })(atomic.SwapPointer(&atomic.x.v, unsafe.Pointer(atomic.new))) }
C:\Users\USER\go\go1.23.4\src\sync\atomic\type.go:57:6: can inline atomic.(*Pointer[go.shape.struct { os.mu sync.Mutex; os.buf *[]uint8; os.bufp int; os.h syscall.Handle; os.vol uint32; os.class uint32; os.path string }]).Store with cost 61 as: method(*atomic.
Pointer[go.shape.struct { os.mu sync.Mutex; os.buf *[]uint8; os.bufp int; os.h syscall.Handle; os.vol uint32; os.class uint32; os.path string }]) func(*[16]uintptr, *go.shape.struct { os.mu sync.Mutex; os.buf *[]uint8; os.bufp int; os.h syscall.Handle; os.vol uint32; os.class uint32; os.path string }) { atomic.StorePointer(&atomic.x.v, unsafe.Pointer(atomic.val)) }
C:\Users\USER\go\go1.23.4\src\sync\atomic\type.go:54:6: can inline atomic.(*Pointer[go.shape.struct { os.mu sync.Mutex; os.buf *[]uint8; os.bufp int; os.h syscall.Handle; os.vol uint32; os.class uint32; os.path string }]).Load with cost 4 as: method(*atomic.Po
inter[go.shape.struct { os.mu sync.Mutex; os.buf *[]uint8; os.bufp int; os.h syscall.Handle; os.vol uint32; os.class uint32; os.path string }]) func(*[16]uintptr) *go.shape.struct { os.mu sync.Mutex; os.buf *[]uint8; os.bufp int; os.h syscall.Handle; os.vol uint32; os.class uint32; os.path string } { return (*go.shape.struct { os.mu sync.Mutex; os.buf *[]uint8; os.bufp int; os.h syscall.Handle; os.vol uint32; os.class uint32; os.path string })(atomic.LoadPointer(&atomic.x.v)) }
C:\Users\USER\go\go1.23.4\src\sync\atomic\type.go:63:6: can inline atomic.(*Pointer[os.dirInfo]).CompareAndSwap with cost 70 as: method(*atomic.Pointer[os.dirInfo]) func(*os.dirInfo, *os.dirInfo) bool { return (*atomic.Pointer[go.shape.struct { os.mu sync.Mutex; os.buf *[]uint8; os.bufp int; os.h syscall.Handle; os.vol uint32; os.class uint32; os.path string }]).CompareAndSwap(atomic.x, &atomic..dict.Pointer[os.dirInfo], atomic.old, atomic.new) }
C:\Users\USER\go\go1.23.4\src\sync\atomic\type.go:60:6: can inline atomic.(*Pointer[os.dirInfo]).Swap with cost 68 as: method(*atomic.Pointer[os.dirInfo]) func(*os.dirInfo) *os.dirInfo { return (*atomic.Pointer[go.shape.struct { os.mu sync.Mutex; os.buf *[]uint8; os.bufp int; os.h syscall.Handle; os.vol uint32; os.class uint32; os.path string }]).Swap(atomic.x, &atomic..dict.Pointer[os.dirInfo], atomic.new) }
C:\Users\USER\go\go1.23.4\src\sync\atomic\type.go:57:6: can inline atomic.(*Pointer[os.dirInfo]).Store with cost 66 as: method(*atomic.Pointer[os.dirInfo]) func(*os.dirInfo) { (*atomic.Pointer[go.shape.struct { os.mu sync.Mutex; os.buf *[]uint8; os.bufp int; os.h syscall.Handle; os.vol uint32; os.class uint32; os.path string }]).Store(atomic.x, &atomic..dict.Pointer[os.dirInfo], atomic.val) }
...
Benchmarking
위 방법들로 heap escapes 보는 방법은 다소 보기 힘들고, escapes to heap이 많아 보여도 실제로 발생하는 object 할당은 적을 수 있고 한 번 할당한 object를 계속 재활용할 수도 있는 등 실제하고 매칭이 안 되는 이슈가 존재합니다.
그래서 이때 벤치마크로 전체적인 속도를 테스트도 하고, 기능 단위 별로 분석을 진행해서 분석합니다.
즉 profiling을 통해 어디를 많이 쓰는 지는 알았으니, 직접적인 속도를 벤치마크로 보는 거죠.
사용 예제는 다음과 같습니다.
$ go test -bench=. -benchmem -benchtime=10s -cpuprofile=cpu.prof -memprofile=mem.prof -gcflags='-m'
# pprof.com
./main.go:16:6: can inline (*TestApp).Close
./main.go:34:6: can inline (*TestApp).OpenSingleFile
./main.go:39:6: can inline (*TestApp).OpenTenFiles
./main.go:60:2: can inline main.deferwrap1
C:\Users\USER\go\go1.23.4\src\sync\atomic\type.go:63:6: can inline atomic.(*Pointer[go.shape.struct { os.mu sync.Mutex; os.buf *[]uint8; os.bufp int; os.h syscall.Handle; os.vol uint32; os.class uint32; os.path string }]).CompareAndSwap
C:\Users\USER\go\go1.23.4\src\sync\atomic\type.go:60:6: can inline atomic.(*Pointer[go.shape.struct { os.mu sync.Mutex; os.buf *[]uint8; os.bufp int; os.h syscall.Handle; os.vol uint32; os.class uint32; os.path string }]).Swap
C:\Users\USER\go\go1.23.4\src\sync\atomic\type.go:57:6: can inline atomic.(*Pointer[go.shape.struct { os.mu sync.Mutex; os.buf *[]uint8; os.bufp int; os.h syscall.Handle; os.vol uint32; os.class uint32; os.path string }]).Store
C:\Users\USER\go\go1.23.4\src\sync\atomic\type.go:54:6: can inline atomic.(*Pointer[go.shape.struct { os.mu sync.Mutex; os.buf *[]uint8; os.bufp int; os.h syscall.Handle; os.vol uint32; os.class uint32; os.path string }]).Load
C:\Users\USER\go\go1.23.4\src\sync\atomic\type.go:63:6: can inline atomic.(*Pointer[os.dirInfo]).CompareAndSwap
C:\Users\USER\go\go1.23.4\src\sync\atomic\type.go:60:6: can inline atomic.(*Pointer[os.dirInfo]).Swap
C:\Users\USER\go\go1.23.4\src\sync\atomic\type.go:57:6: can inline atomic.(*Pointer[os.dirInfo]).Store
C:\Users\USER\go\go1.23.4\src\sync\atomic\type.go:54:6: can inline atomic.(*Pointer[os.dirInfo]).Load
./main.go:27:13: inlining call to log.Printf
./main.go:66:17: inlining call to (*TestApp).OpenTenFiles
./main.go:67:10: inlining call to (*TestApp).Close
./main.go:75:18: inlining call to (*TestApp).OpenSingleFile
./main.go:76:16: inlining call to (*TestApp).OpenTenFiles
./main.go:60:15: inlining call to (*TestApp).Close
C:\Users\USER\go\go1.23.4\src\sync\atomic\type.go:63:6: inlining call to atomic.(*Pointer[go.shape.struct { os.mu sync.Mutex; os.buf *[]uint8; os.bufp int; os.h syscall.Handle; os.vol uint32; os.class uint32; os.path string }]).CompareAndSwap
C:\Users\USER\go\go1.23.4\src\sync\atomic\type.go:60:6: inlining call to atomic.(*Pointer[go.shape.struct { os.mu sync.Mutex; os.buf *[]uint8; os.bufp int; os.h syscall.Handle; os.vol uint32; os.class uint32; os.path string }]).Swap
C:\Users\USER\go\go1.23.4\src\sync\atomic\type.go:57:6: inlining call to atomic.(*Pointer[go.shape.struct { os.mu sync.Mutex; os.buf *[]uint8; os.bufp int; os.h syscall.Handle; os.vol uint32; os.class uint32; os.path string }]).Store
C:\Users\USER\go\go1.23.4\src\sync\atomic\type.go:54:6: inlining call to atomic.(*Pointer[go.shape.struct { os.mu sync.Mutex; os.buf *[]uint8; os.bufp int; os.h syscall.Handle; os.vol uint32; os.class uint32; os.path string }]).Load
./main.go:51:18: inlining call to (*TestApp).OpenTenFiles
./main.go:52:11: inlining call to sync.(*WaitGroup).Done
./main.go:20:10: (*TestApp).Close ignoring self-assignment in a.files = a.files[:0]
./main.go:16:7: leaking param content: a
./main.go:24:7: leaking param content: a
./main.go:24:24: leaking param: name
C:\Users\USER\go\go1.23.4\src\log\log.go:397:24: leaking param: b to result ~r0 level=0
./main.go:27:13: ... argument does not escape
./main.go:27:13: func literal does not escape
./main.go:34:7: leaking param content: a
./main.go:34:34: leaking param: name
./main.go:39:7: leaking param content: a
./main.go:39:32: leaking param: name
./main.go:46:7: leaking param: a
./main.go:46:44: leaking param: name
./main.go:47:2: moved to heap: wg
./main.go:50:6: func literal escapes to heap
./main.go:60:15: main.deferwrap1 ignoring self-assignment in a.files = a.files[:0]
./main.go:67:10: main ignoring self-assignment in a.files = a.files[:0]
./main.go:59:7: &TestApp{} escapes to heap
./main.go:81:12: ... argument does not escape
? pprof.com [no test files]- -benchmem : 한 번의 bench loop에서 메모리 할당량을 측정
- -cpuprofile, -memprofile : 프로파일링 결과를 파일로 저장하여 Heap 할당 위치 확인 가능
- -gcflags=’-m’ : 위에서 나온 거와 같이 Heap 할당 발생 여부를 확인
Heap 할당 줄이는 Tip
애초에 힙에 할당되는 메모리를 줄이는 것도 좋습니다.
1) 비정형 인자(Avoid any, interface {})의 사용 최소화
아래 코드에서 j, k는 Heap 메모리에 할당됩니다.
fmt.Println, fmt.Printf와 같은 함수는 any 타입을 사용하기 때문에 타입 정보를 저장해야 해서 Heap 할당을 유발합니다.
package main
import "fmt"
func main() {
    i := 0
    j := i + 1  // j escapes to heap
    k := j + 1  // k escapes to heap
    fmt.Println(j)
    fmt.Printf("%d\n", k)
}비정형 인자는 코드 가독성을 높여주지만, 성능이 중요한 경우 최소한으로 사용해야 합니다.
2) 효율적인 Logger 선택
Logging은 Heap 할당을 많이 유발할 수 있습니다.
- log.Println() : any를 사용해 무조건 Heap 할당 발생
- slog : 타입을 지정해도 내부적으로 Heap 할당 발생
- zap : Primitive 타입은 Stack에 할당하여 성능 향상
3) 포인터 사용 주의 (CallByValue 활용)
Golang에서는 포인터 변수를 사용하면 무조건 Heap 할당이 발생합니다. 작은 구조체라면 포인터 대신 값 복사를 사용하는 것이 더 효율적일 수 있습니다.
4) Slice 생성 시 Capacity 지정
s := make([]int, n, 1024) // Heap 할당 방지 가능Golang에서 capacity나 len을 명확히 지정하면 Heap 할당을 방지할 수 있습니다.
5) sync.Pool 활용
객체 할당을 줄이기 위해 sync.Pool을 사용할 수 있습니다, 하지만 Pool을 관리하는 연산이 추가된 무로 CPU 사용 증가량을 확인해줘야 합니다.
var pool = sync.Pool{
    New: func() any {
        res := make([]int, 256)
        return &res
    },
}
6) 최신 패키지 활용 (slices.SortFunc vs sort.Slice)
goLang은 빠르게 업데이트가 이루어지다 보니 버전마다 heap 할당이 다릅니다.
최신 버전에서는 이전에 heap을 할당하던 로직이었던 부분을 개선할 수 있으니 가능한 최신 패키지를 사용합시다.
참조
- [Go] pprof를 사용해 profiling을 해보자(부제: 당신은 서버 이상 원인을 어떻게 찾으시나요?)
- 프로파일링 적용기 - 당신의 Go 애플리케이션은 좀 더 나아질 수 있다
- [도서] Go 성능 최적화 가이드
'Go Lang > Study' 카테고리의 다른 글
| [GoLang] 시간 초과 로직 Context, 채널과 비교 (0) | 2025.02.25 |
|---|---|
| [GoLang] net/http에서 http 요청을 동시적으로 처리하는 이유 (0) | 2025.02.17 |
| [GoLang] Garbage Collector 개념 (0) | 2025.01.29 |
| [GoLang] 추상 팩토리 디자인 사용해보기 (1) | 2025.01.17 |
| [GoLang] GraphQL API 만들기 part 1 (라이브러리 탐색) (38) | 2024.03.01 |
개요
지난번 글에서 이어져서, 튜닝을 직접 해보는 글입니다.
https://seung.tistory.com/entry/GoLang-Garbage-Collector-%EA%B0%9C%EB%85%90
[GoLang] Garbage Collector 개념
GC, Garbage Collector Garbage Collector(GC)은 프로그램 실행 중 사용되지 않는 메모리를 자동으로 회수하는 메모리 관리 기법이다.이를 통해 개발자는 명시적으로 메모리를 해제할 필요 없이, 안전하고
seung.tistory.com
저번 글에서 GC, CMS, STW, GC의 청소 대상, TCMalloc 등을 알아보았는데
GC 튜닝은 메모리 사용량, CPU 사용량 그리고 STW(Stop-The-World) 시간 사이의 trade-off(절충)을 하는 작업입니다.
여기저기 고치면서 현재 환경에서 더 나은 퍼포먼스를 보여주는 값을 찾는거죠
예를 들자면
- 메모리 여유가 많을 경우
- GC 임계값을 높여서 더 많은 힙 메모리를 허용해서 GC 실행빈도를 줄여서
- 그 결과로 CPU 오버헤드와 STW 시간을 줄여 응답속도를 개선할 수 있습니다.
- 메모리 제약이 심한 경우
- GC 임계값을 낮춰 더 자주 GC를 수행하여 힙 메모리의 사용량을 줄일 수 있습니다.
- 다만, 이럴 경우 STW 시간이 늘어나거나, CPU 사용량이 증가합니다.
즉 GC 튜닝은 애플리케이션의 특성과 실행환경에 맞춰 최적의 균형점을 찾는 게 목적으로 정답이 있는 게 아닙니다.
여기서는 튜닝을 하기 위해서 볼 수 있는 여러 지표에 대해 알아봅시다.
간단하게 기존 프로젝트에서 맛보려면 다음 방법도 좋습니다.
import (
	...
	_ "net/http/pprof"
)


func main() {

	go func() {
		http.ListenAndServe("0.0.0.0:6060", nil)
	}()

    ...
}
pprof.go에서 다음과 같이 라우팅을 설정해주는데
func init() {
	http.HandleFunc("/debug/pprof/", Index)
	http.HandleFunc("/debug/pprof/cmdline", Cmdline)
	http.HandleFunc("/debug/pprof/profile", Profile)
	http.HandleFunc("/debug/pprof/symbol", Symbol)
	http.HandleFunc("/debug/pprof/trace", Trace)
}
다음처럼 간편하게 확인할 수 있습니다.
시각화 하기위해서는 위 서번는 별도로 두고 아래 명령어로 볼 수 있습니다, 그러기 위해선 아래에 있는 graphviz가 필요하죠
go tool pprof -http 0.0.0.0:8088 http://0.0.0.0:6060/debug/pprof/heap
go tool pprof -http 0.0.0.0:8088 http://0.0.0.0:6060/debug/pprof/goroutine
추가적인 명령어는 이 사이트가 정리를 잘했더군요
https://pangyoalto.com/go-using-pprof-for-profiing/
[Go] pprof를 사용해 profiling을 해보자(부제: 당신은 서버 이상 원인을 어떻게 찾으시나요?)
[요약] 1. pprof는 go 어플리케이션을 profiling 해주는 도구이다. 2. go는 go tool에서 pprof를 기본적으로 지원해주기 때문에 쉽게 pprof를 이용할 수 있다. 3. graphviz를 통해 분석을 시각화해서 볼 수 있다.
pangyoalto.com
Profiling
위 방법은 편리하지만, 원하는 로직 부분에 적용하려면 이 방법을 쓰는게 좋습니다.
Go에서 profiling을 해주는 도구로 pprof를 쓸 수 있습니다, go tool에서 기본적으로 지원하며 이걸 주로 사용합니다.
https://github.com/google/pprof?ref=pangyoalto.com
GitHub - google/pprof: pprof is a tool for visualization and analysis of profiling data
pprof is a tool for visualization and analysis of profiling data - google/pprof
github.com
프로파일링 데이터를 시각화할 때 Graphviz를 필요로 하기에, 설치 및 시스템 환경변수 등록을 합니다.
Graphviz
Please join the Graphviz forum to ask questions and discuss Graphviz. What is Graphviz? Graphviz is open source graph visualization software. Graph visualization is a way of representing structural information as diagrams of abstract graphs and networks. I
graphviz.org
C:\Program Files\Graphviz\bin
환경변수 등록이 완료되었다면 다음처럼 dot -v 명령어로 정상적으로 실행되는 걸 확인할 수 있죠
Pprof Smaple
아래 샘플을 만들며 pprof 도구에 사용법을 정리해 봅시다.
파일을 읽어서 메모리를 차지하는 코드이며 한번 읽고 열 번 읽고 고루틴으로 백번 읽는 코드입니다.
main.go
package main

import (
	"io"
	"log"
	"pprof.com/fd"
	"sync"
)

// TestApp은 파일 디스크립터 관리를 담당하는 구조체
type TestApp struct {
	files []io.ReadCloser // 열려 있는 파일 리스트
}

// 모든 열린 파일을 닫고, 리스트를 초기화하여 FD 누수를 방지
func (a *TestApp) Close() {
	for _, cl := range a.files {
		_ = cl.Close()
	}
	a.files = a.files[:0] // 파일 디스크립터 절약
}

// 파일을 열고 TestApp에 추가 (pprof 프로파일링 포함)
func (a *TestApp) open(name string) {
	f, err := fd.Open(name) // pprof 프로파일링 포함
	if err != nil {
		log.Printf("File Not Found : %v", err)
		return // 에러 발생 시 추가하지 않음
	}
	a.files = append(a.files, f)
}

// 단일 파일 열기
func (a *TestApp) OpenSingleFile(name string) {
	a.open(name)
}

// 동일한 파일을 10개 연속으로 열기 (테스트용)
func (a *TestApp) OpenTenFiles(name string) {
	for i := 0; i < 10; i++ {
		a.open(name)
	}
}

// 파일을 100개 동시(고루틴)로 열기 (멀티스레드 테스트)
func (a *TestApp) Open100FilesConcurrently(name string) {
	wg := sync.WaitGroup{}
	wg.Add(10) // 10개의 고루틴 실행
	for i := 0; i < 10; i++ {
		go func() {
			a.OpenTenFiles(name) // 각 고루틴이 10개씩 파일을 엶
			wg.Done()
		}()
	}
	wg.Wait() // 모든 고루틴이 끝날 때까지 대기
}

func main() {
	a := &TestApp{}
	defer a.Close() // 실행 종료 시 모든 열린 파일 닫기

	testFilePath := "./test.txt"

	// 프로파일링을 위해 반복적인 파일 열기 및 닫기
	for i := 0; i < 10; i++ {
		a.OpenTenFiles(testFilePath)
		a.Close() // 닫기 호출하여 FD 누수 방지
	}

	// pprof 분석을 위해 실제로 열릴 파일
	f, _ := fd.Open(testFilePath)
	a.files = append(a.files, f)

	// 다양한 파일 열기 시나리오 실행
	a.OpenSingleFile(testFilePath)
	a.OpenTenFiles(testFilePath)
	a.Open100FilesConcurrently(testFilePath)

	// 현재 파일 디스크립터 사용 내역을 pprof 파일로 저장
	if err := fd.Write("fd.pprof"); err != nil {
		log.Fatal(err)
	}
}
fd/fileDescriptor.go
package fd

import (
	"os"
	"runtime/pprof"
)

// `pprof.NewProfile("fd.inuse")`
// - 이 프로파일은 현재 사용 중인 파일 디스크립터(FD) 개수를 추적하는 용도로 사용됨
// - `pprof.Lookup("fd.inuse")`로 다른 패키지에서도 조회 가능
// - 전역 변수로 설정하면 특정 파일에서만 사용하기 어려우므로 일반적으로는 지양함
var fdProfile = pprof.NewProfile("fd.inuse")

// File 구조체는 os.File을 래핑하여 pprof와 연동되도록 설계됨
type File struct {
	*os.File
}

// 파일을 열고 프로파일링에 추가하는 함수
func Open(name string) (*File, error) {
	f, err := os.Open(name)
	if err != nil {
		return nil, err
	}
	// `Add(f, 2)`에서 2는 스택 프레임을 몇 개 건너뛸지를 결정함
	// 1: Open() 자신
	// 2: Open()을 호출한 상위 함수
	// 프로파일러에 Open 상위 함수를 기록하기 위한 용도
	fdProfile.Add(f, 2)
	return &File{File: f}, nil
}

// 파일을 닫을 때 pprof 프로파일에서 제거하는 함수
func (f *File) Close() error {
	// 추적하던 파일이 닫히는 순간, 프로파일에서 제거
	defer fdProfile.Remove(f.File)
	return f.File.Close()
}

// 현재 열려 있는 파일 디스크립터 목록을 pprof 파일로 저장하는 함수
func Write(profileOutPath string) error {
	out, err := os.Create(profileOutPath)
	if err != nil {
		return err
	}
	defer out.Close()

	// 현재 pprof 프로파일 기록 (0: 기본 출력 레벨)
	if err := fdProfile.WriteTo(out, 0); err != nil {
		return err
	}
	return nil
}
그리고 프로젝트 루트 단 아래에 test.txt를 추가합니다.
다음 명령어로 cli에서도 실행이 가능합니다
go tool pprof fd.pprof위 명령어로, cli에 접속하면 아래 명령어 등을 입력할 수 있게 됩니다.
아래 명령어를 통해 cmd로 보면 눈이 다소 피로하므로
- top : 가장 많은 연산을 차지한 함수 확인
- list main.main : 특정 함수별 실행 정보 확인
- web : 호출 그래프 시각화 (Graphviz 필요)
처음부터 브라우저에서 시각화를 통해 확인하는 게 가능하므로 그걸 기준으로 사용법을 보죠
코드를 통해 생성한 fd.pprof를 실행합니다.
go tool pprof -http=:8080 fd.pprof
이제 http://localhost:8080/ui/로 접속하면 아래 이미지처럼 볼 수 있습니다.
위 기본 그래프 페이지로 알 수 있는 건 아래와 같습니다.
| 노드의 크기 | 크기가 클 수록 직접 사용된 빈도가 높다는 걸로, 시스템의 자원이나 사용 시간을 많이 사용 |
| 노드 테두리 및 색상 | 사용 빈도로, 일반적으로 금색이지만 사용될 수록 빨갛게 표현되고, 사용 값이 0에 가깝다면 회색 |
| 엣지 | 노드와 마찬가지로 색상과 두께로 사용빈도를 나타내고, 추가로 가중치도 표현 |
| 점선 엣지 | pprof로 보여줄 수 있는 노드의 제한은 가독성을 위해 80개로 되어있는데, 안보이는 걸 점선으로 표시 |
이런 정보들로 위 코드에서 main이 아닌 새로운 고루틴을 통해 실행된 Open100FilesConcurrently가 누적사용량이 제일 많고, 가장 파일을 가장 많이 개방한 건 Open 함수인걸 알 수 있습니다.
View 모드를 Top으로 하여 아래와 같이 한눈에 볼 수도 있죠
Flame Graph로 하면 직사각형으로 백분율 하여 볼 수 있고, 클릭해서 정확한 퍼센티지도 알 수 있
이 외에도 Peek, Source, Disassembel 모드로 직접적인 코드를 보면서 자원 사용량도 알 수 있습니다.
여기까지만 보면 GC를 수정함으로써 가장 달라지는 부분은 파일 디스크립터 사용이 많아지면서 메모리를 많이 차지하는 부분이 가장 영향을 많이 받게 되는데, 아래 세 곳이 가장 영향이 많이 받는다고 생각할 수 있습니다.
| Open100FilesConcurrently | 실행 직후로, 이 함수가 실행되면 짧은 시간 동안 FD가 급증했다가 닫히고 이 시점에서 GC를 실행하면 힙 메모리를 정리할 수 있음 |
| OpenTenFiles | 내부에서 일정 개수 이상일 때 GC를 실행으로 CPU 부담은 적어지지만 GC가 자주 발생되어 성능 저하가 발생할 수 있음 |
| TestApp의 close | FD 해제 후 GC를 실행하면 정리 효과는 극대화되지만 불필요한 GC 실행이 많아짐 |
이 중에 처음에 나온 Open100FilesConcurrently 실행 직후에 GC를 실행시킨다면 아래처럼 수정할 수도 있네요
// 파일을 100개 동시(고루틴)로 열기 (멀티스레드 테스트)
func (a *TestApp) Open100FilesConcurrently(name string) {
	wg := sync.WaitGroup{}
	wg.Add(10) // 10개의 고루틴 실행
	for i := 0; i < 10; i++ {
		go func() {
			a.OpenTenFiles(name) // 각 고루틴이 10개씩 파일을 엶
			wg.Done()
		}()
	}
	wg.Wait() // 모든 고루틴이 끝날 때까지 대기
	runtime.GC()
}
Heap Memory
위 코드를 profiling 하면서 무슨 부분이 크게 메모리를 잡아먹는지는 다른 함수들과 상대비교로 하면서 튜닝할 수 있는 포인트는 알 수 있었습니다.
하지만 GC 튜닝을 적용하기에는 좀 추상적인 지표로 느껴집니다.
찾아낸 부분에서 어떻게 객체가 메모리에 할당이 되는지를 알아야 전체적으로 GC가 필요한 객체를 줄이고 튜닝할 수 있는 거죠.
이때 알면 좋은 게 환경변수 gctrace와 컴파일러 빌드 옵션인 gcflags 등이 있습니다.
GODEBUG=gctrace
간단하게 Go에서는 환경변수를 변경하는 걸로 GC 관련 로그들을 출력할 수 있습니다
로그에는 GC 주기, 힙 메모리 크기 변화, pause 시간등을 포함하게 됩니다.
이걸로 아래 사항들을 참조할 수 있죠
- 실시간 모니터링 : 런타임에 GC가 실행될 때마다 쉽게 확인이 되며, GC 튜닝에 중요한 정보를 제공해 줌
- 문제 진단 : GC 동작 패턴을 파악하며 메모리 사용 최적화 또는 STW 시간을 최소화하는데 도움을 줌
gctrace=1은 아래와 같이 나오는데, 단일 행으로 메모리 양과 일시 중지 길이를 요약합니다.
export GODEBUG=gctrace=1
go run main.go
----------------------------------------
gc 1 @0.058s 0%: 0+0.51+0 ms clock, 0+0/0/0+0 ms cpu, 3->4->1 MB, 4 MB goal, 0 MB stacks, 0 MB globals, 24 P
gc 2 @0.060s 0%: 0+0.51+0 ms clock, 0+0/0/0+0 ms cpu, 3->4->1 MB, 4 MB goal, 0 MB stacks, 0 MB globals, 24 P
gc 3 @0.061s 0%: 0+0.51+0 ms clock, 0+0/1.0/0+0 ms cpu, 3->4->1 MB, 4 MB goal, 0 MB stacks, 0 MB globals, 24 P
gc 4 @0.063s 0%: 0+0.51+0 ms clock, 0+0/2.0/0+0 ms cpu, 3->4->1 MB, 4 MB goal, 0 MB stacks, 0 MB globals, 24 P
gc 5 @0.064s 0%: 0+0+0 ms clock, 0+0/0/0+0 ms cpu, 3->3->1 MB, 4 MB goal, 0 MB stacks, 0 MB globals, 24 P
gc 6 @0.065s 0%: 0+0.51+0 ms clock, 0+1.0/1.0/0+0 ms cpu, 3->4->1 MB, 4 MB goal, 0 MB stacks, 0 MB globals, 24 P
gc 7 @0.066s 0%: 0+0.52+0 ms clock, 0+0/0/0+0 ms cpu, 3->4->1 MB, 4 MB goal, 0 MB stacks, 0 MB globals, 24 P
gc 8 @0.067s 0%: 0+0.51+0 ms clock, 0+0/2.5/0.51+0 ms cpu, 3->5->1 MB, 4 MB goal, 0 MB stacks, 0 MB globals, 24 P
...
gctrace=2로 할 경우 더 상세하게 gc 단계별 (마크, 스윕) 소요 시간과 구체적인 메모리 사용 통계를 볼 수 있습니다.
하지만 이 예제에서는 동일하게 출력이 되므로 패스를 하고
이 로그를 보는 법은 go 문서에서도 잘 나와있는데 아래와 같습니다.
gc # @#s #%: #+...+# ms clock, #+...+# ms cpu, #->#-># MB, # MB goal, # P

gc #        the GC number, incremented at each GC
@#s         time in seconds since program start
#%          percentage of time spent in GC since program start
#+...+#     wall-clock/CPU times for the phases of the GC
#->#-># MB  heap size at GC start, at GC end, and live heap
# MB goal   goal heap size
# P         number of processors used
마지막으로 gcpacertrace=1로 더 자세한 GC, Concurrent Pacer의 정보도 알 수 있죠.
export GODEBUG=gctrace=1,gcpacertrace=1
go run main.go
--------------------------------------------------------
pacer: assist ratio=+3.303079e+000 (scan 0 MB in 3->4 MB) workers=6++0.000000e+000
pacer: 25% CPU (25 exp.) for 534296+41640+460000 B work (460000 B exp.) in 4055040 B -> 4677632 B (∆goal 483328, cons/mark +0.000000e+000)
gc 1 @0.054s 0%: 0+1.0+0 ms clock, 0+0/0/0+0 ms cpu, 3->4->1 MB, 4 MB goal, 0 MB stacks, 0 MB globals, 24 P
pacer: assist ratio=+1.896859e+000 (scan 0 MB in 3->4 MB) workers=6++0.000000e+000
pacer: 25% CPU (25 exp.) for 643456+43216+460000 B work (1040480 B exp.) in 3645776 B -> 4602016 B (∆goal 407712, cons/mark +2.003316e-001)
gc 2 @0.056s 1%: 0+0+0.99 ms clock, 0+0/0/0+23 ms cpu, 3->4->1 MB, 4 MB goal, 0 MB stacks, 0 MB globals, 24 P
pacer: assist ratio=+1.605905e+000 (scan 0 MB in 3->4 MB) workers=6++0.000000e+000
pacer: 25% CPU (25 exp.) for 570712+46392+460000 B work (1148376 B exp.) in 3479208 B -> 4459488 B (∆goal 265184, cons/mark +2.779755e-001)
gc 3 @0.057s 1%: 0+1.0+0 ms clock, 0+0/2.0/0+0 ms cpu, 3->4->1 MB, 4 MB goal, 0 MB stacks, 0 MB globals, 24 P
pacer: assist ratio=+1.186420e+000 (scan 0 MB in 3->4 MB) workers=6++0.000000e+000
pacer: 25% CPU (25 exp.) for 626008+41424+460000 B work (1079376 B exp.) in 3284528 B -> 4015512 B (∆goal -178792, cons/mark +3.033690e-001)
gc 4 @0.059s 1%: 0+0+0 ms clock, 0+0/0/0+0 ms cpu, 3->3->1 MB, 4 MB goal, 0 MB stacks, 0 MB globals, 24 P
pacer: assist ratio=+1.450420e+000 (scan 0 MB in 3->4 MB) workers=6++0.000000e+000
pacer: 25% CPU (25 exp.) for 676328+33520+460000 B work (1130272 B exp.) in 3415032 B -> 4948368 B (∆goal 754064, cons/mark +3.033690e-001)
gc 5 @0.061s 2%: 0.29+0+0 ms clock, 7.1+0/0/0+0 ms cpu, 3->4->1 MB, 4 MB goal, 0 MB stacks, 0 MB globals, 24 P
pacer: assist ratio=+1.630934e+000 (scan 0 MB in 3->4 MB) workers=6++0.000000e+000
pacer: 25% CPU (25 exp.) for 691064+61168+460000 B work (1172120 B exp.) in 3475624 B -> 4953600 B (∆goal 759296, cons/mark +4.369046e-001)
gc 6 @0.062s 2%: 0+1.0+0 ms clock, 0+0/0/0+0 ms cpu, 3->4->1 MB, 4 MB goal, 0 MB stacks, 0 MB globals, 24 P
하지만 위 방법도 특정 객체로 세분화해서 알기는 쉽지 않죠
완전히 세세한 객체들의 메모리 할당이 어디서 어디로, Stack인지, Heap인지 또는 왜 거기로 갔는지 코드 위치는 어디인지까지 볼 수 있는데 아래 옵션을 통해 알 수 있죠
-gcflags='-m', -gcflags=‘-m -m’
m을 하나만 붙이면 지난 글에서 적었던 Escape Analysis만 알 수 있습니다
하지만 m을 더 붙이면 아래처럼 엄청 자세하게 볼 수 있죠
$ go build -gcflags='-m -m' main.go
# command-line-arguments
./main.go:16:6: can inline (*TestApp).Close with cost 76 as: method(*TestApp) func() { for loop; a.files = a.files[:0] }
./main.go:24:6: cannot inline (*TestApp).open: function too complex: cost 164 exceeds budget 80
./main.go:34:6: can inline (*TestApp).OpenSingleFile with cost 60 as: method(*TestApp) func(string) { (*TestApp).open(a, name) }
./main.go:39:6: can inline (*TestApp).OpenTenFiles with cost 72 as: method(*TestApp) func(string) { for loop }
./main.go:46:6: cannot inline (*TestApp).Open100FilesConcurrently: unhandled op GO
./main.go:50:6: cannot inline (*TestApp).Open100FilesConcurrently.func1: function too complex: cost 138 exceeds budget 80
./main.go:58:6: cannot inline main: unhandled op DEFER
./main.go:60:2: can inline main.deferwrap1 with cost 78 as: func() { (*TestApp).Close(.autotmp_1) }
C:\Users\USER\go\go1.23.4\src\sync\atomic\type.go:63:6: can inline atomic.(*Pointer[go.shape.struct { os.mu sync.Mutex; os.buf *[]uint8; os.bufp int; os.h syscall.Handle; os.vol uint32; os.class uint32; os.path string }]).CompareAndSwap with cost 63 as: method
(*atomic.Pointer[go.shape.struct { os.mu sync.Mutex; os.buf *[]uint8; os.bufp int; os.h syscall.Handle; os.vol uint32; os.class uint32; os.path string }]) func(*[16]uintptr, *go.shape.struct { os.mu sync.Mutex; os.buf *[]uint8; os.bufp int; os.h syscall.Handle
; os.vol uint32; os.class uint32; os.path string }, *go.shape.struct { os.mu sync.Mutex; os.buf *[]uint8; os.bufp int; os.h syscall.Handle; os.vol uint32; os.class uint32; os.path string }) bool { return atomic.CompareAndSwapPointer(&atomic.x.v, unsafe.Pointer(atomic.old), unsafe.Pointer(atomic.new)) }
C:\Users\USER\go\go1.23.4\src\sync\atomic\type.go:60:6: can inline atomic.(*Pointer[go.shape.struct { os.mu sync.Mutex; os.buf *[]uint8; os.bufp int; os.h syscall.Handle; os.vol uint32; os.class uint32; os.path string }]).Swap with cost 62 as: method(*atomic.P
ointer[go.shape.struct { os.mu sync.Mutex; os.buf *[]uint8; os.bufp int; os.h syscall.Handle; os.vol uint32; os.class uint32; os.path string }]) func(*[16]uintptr, *go.shape.struct { os.mu sync.Mutex; os.buf *[]uint8; os.bufp int; os.h syscall.Handle; os.vol u
int32; os.class uint32; os.path string }) *go.shape.struct { os.mu sync.Mutex; os.buf *[]uint8; os.bufp int; os.h syscall.Handle; os.vol uint32; os.class uint32; os.path string } { return (*go.shape.struct { os.mu sync.Mutex; os.buf *[]uint8; os.bufp int; os.h syscall.Handle; os.vol uint32; os.class uint32; os.path string })(atomic.SwapPointer(&atomic.x.v, unsafe.Pointer(atomic.new))) }
C:\Users\USER\go\go1.23.4\src\sync\atomic\type.go:57:6: can inline atomic.(*Pointer[go.shape.struct { os.mu sync.Mutex; os.buf *[]uint8; os.bufp int; os.h syscall.Handle; os.vol uint32; os.class uint32; os.path string }]).Store with cost 61 as: method(*atomic.
Pointer[go.shape.struct { os.mu sync.Mutex; os.buf *[]uint8; os.bufp int; os.h syscall.Handle; os.vol uint32; os.class uint32; os.path string }]) func(*[16]uintptr, *go.shape.struct { os.mu sync.Mutex; os.buf *[]uint8; os.bufp int; os.h syscall.Handle; os.vol uint32; os.class uint32; os.path string }) { atomic.StorePointer(&atomic.x.v, unsafe.Pointer(atomic.val)) }
C:\Users\USER\go\go1.23.4\src\sync\atomic\type.go:54:6: can inline atomic.(*Pointer[go.shape.struct { os.mu sync.Mutex; os.buf *[]uint8; os.bufp int; os.h syscall.Handle; os.vol uint32; os.class uint32; os.path string }]).Load with cost 4 as: method(*atomic.Po
inter[go.shape.struct { os.mu sync.Mutex; os.buf *[]uint8; os.bufp int; os.h syscall.Handle; os.vol uint32; os.class uint32; os.path string }]) func(*[16]uintptr) *go.shape.struct { os.mu sync.Mutex; os.buf *[]uint8; os.bufp int; os.h syscall.Handle; os.vol uint32; os.class uint32; os.path string } { return (*go.shape.struct { os.mu sync.Mutex; os.buf *[]uint8; os.bufp int; os.h syscall.Handle; os.vol uint32; os.class uint32; os.path string })(atomic.LoadPointer(&atomic.x.v)) }
C:\Users\USER\go\go1.23.4\src\sync\atomic\type.go:63:6: can inline atomic.(*Pointer[os.dirInfo]).CompareAndSwap with cost 70 as: method(*atomic.Pointer[os.dirInfo]) func(*os.dirInfo, *os.dirInfo) bool { return (*atomic.Pointer[go.shape.struct { os.mu sync.Mutex; os.buf *[]uint8; os.bufp int; os.h syscall.Handle; os.vol uint32; os.class uint32; os.path string }]).CompareAndSwap(atomic.x, &atomic..dict.Pointer[os.dirInfo], atomic.old, atomic.new) }
C:\Users\USER\go\go1.23.4\src\sync\atomic\type.go:60:6: can inline atomic.(*Pointer[os.dirInfo]).Swap with cost 68 as: method(*atomic.Pointer[os.dirInfo]) func(*os.dirInfo) *os.dirInfo { return (*atomic.Pointer[go.shape.struct { os.mu sync.Mutex; os.buf *[]uint8; os.bufp int; os.h syscall.Handle; os.vol uint32; os.class uint32; os.path string }]).Swap(atomic.x, &atomic..dict.Pointer[os.dirInfo], atomic.new) }
C:\Users\USER\go\go1.23.4\src\sync\atomic\type.go:57:6: can inline atomic.(*Pointer[os.dirInfo]).Store with cost 66 as: method(*atomic.Pointer[os.dirInfo]) func(*os.dirInfo) { (*atomic.Pointer[go.shape.struct { os.mu sync.Mutex; os.buf *[]uint8; os.bufp int; os.h syscall.Handle; os.vol uint32; os.class uint32; os.path string }]).Store(atomic.x, &atomic..dict.Pointer[os.dirInfo], atomic.val) }$ go build -gcflags='-m -m' main.go
# command-line-arguments
./main.go:16:6: can inline (*TestApp).Close with cost 76 as: method(*TestApp) func() { for loop; a.files = a.files[:0] }
./main.go:24:6: cannot inline (*TestApp).open: function too complex: cost 164 exceeds budget 80
./main.go:34:6: can inline (*TestApp).OpenSingleFile with cost 60 as: method(*TestApp) func(string) { (*TestApp).open(a, name) }
./main.go:39:6: can inline (*TestApp).OpenTenFiles with cost 72 as: method(*TestApp) func(string) { for loop }
./main.go:46:6: cannot inline (*TestApp).Open100FilesConcurrently: unhandled op GO
./main.go:50:6: cannot inline (*TestApp).Open100FilesConcurrently.func1: function too complex: cost 138 exceeds budget 80
./main.go:58:6: cannot inline main: unhandled op DEFER
./main.go:60:2: can inline main.deferwrap1 with cost 78 as: func() { (*TestApp).Close(.autotmp_1) }
C:\Users\USER\go\go1.23.4\src\sync\atomic\type.go:63:6: can inline atomic.(*Pointer[go.shape.struct { os.mu sync.Mutex; os.buf *[]uint8; os.bufp int; os.h syscall.Handle; os.vol uint32; os.class uint32; os.path string }]).CompareAndSwap with cost 63 as: method
(*atomic.Pointer[go.shape.struct { os.mu sync.Mutex; os.buf *[]uint8; os.bufp int; os.h syscall.Handle; os.vol uint32; os.class uint32; os.path string }]) func(*[16]uintptr, *go.shape.struct { os.mu sync.Mutex; os.buf *[]uint8; os.bufp int; os.h syscall.Handle
; os.vol uint32; os.class uint32; os.path string }, *go.shape.struct { os.mu sync.Mutex; os.buf *[]uint8; os.bufp int; os.h syscall.Handle; os.vol uint32; os.class uint32; os.path string }) bool { return atomic.CompareAndSwapPointer(&atomic.x.v, unsafe.Pointer(atomic.old), unsafe.Pointer(atomic.new)) }
C:\Users\USER\go\go1.23.4\src\sync\atomic\type.go:60:6: can inline atomic.(*Pointer[go.shape.struct { os.mu sync.Mutex; os.buf *[]uint8; os.bufp int; os.h syscall.Handle; os.vol uint32; os.class uint32; os.path string }]).Swap with cost 62 as: method(*atomic.P
ointer[go.shape.struct { os.mu sync.Mutex; os.buf *[]uint8; os.bufp int; os.h syscall.Handle; os.vol uint32; os.class uint32; os.path string }]) func(*[16]uintptr, *go.shape.struct { os.mu sync.Mutex; os.buf *[]uint8; os.bufp int; os.h syscall.Handle; os.vol u
int32; os.class uint32; os.path string }) *go.shape.struct { os.mu sync.Mutex; os.buf *[]uint8; os.bufp int; os.h syscall.Handle; os.vol uint32; os.class uint32; os.path string } { return (*go.shape.struct { os.mu sync.Mutex; os.buf *[]uint8; os.bufp int; os.h syscall.Handle; os.vol uint32; os.class uint32; os.path string })(atomic.SwapPointer(&atomic.x.v, unsafe.Pointer(atomic.new))) }
C:\Users\USER\go\go1.23.4\src\sync\atomic\type.go:57:6: can inline atomic.(*Pointer[go.shape.struct { os.mu sync.Mutex; os.buf *[]uint8; os.bufp int; os.h syscall.Handle; os.vol uint32; os.class uint32; os.path string }]).Store with cost 61 as: method(*atomic.
Pointer[go.shape.struct { os.mu sync.Mutex; os.buf *[]uint8; os.bufp int; os.h syscall.Handle; os.vol uint32; os.class uint32; os.path string }]) func(*[16]uintptr, *go.shape.struct { os.mu sync.Mutex; os.buf *[]uint8; os.bufp int; os.h syscall.Handle; os.vol uint32; os.class uint32; os.path string }) { atomic.StorePointer(&atomic.x.v, unsafe.Pointer(atomic.val)) }
C:\Users\USER\go\go1.23.4\src\sync\atomic\type.go:54:6: can inline atomic.(*Pointer[go.shape.struct { os.mu sync.Mutex; os.buf *[]uint8; os.bufp int; os.h syscall.Handle; os.vol uint32; os.class uint32; os.path string }]).Load with cost 4 as: method(*atomic.Po
inter[go.shape.struct { os.mu sync.Mutex; os.buf *[]uint8; os.bufp int; os.h syscall.Handle; os.vol uint32; os.class uint32; os.path string }]) func(*[16]uintptr) *go.shape.struct { os.mu sync.Mutex; os.buf *[]uint8; os.bufp int; os.h syscall.Handle; os.vol uint32; os.class uint32; os.path string } { return (*go.shape.struct { os.mu sync.Mutex; os.buf *[]uint8; os.bufp int; os.h syscall.Handle; os.vol uint32; os.class uint32; os.path string })(atomic.LoadPointer(&atomic.x.v)) }
C:\Users\USER\go\go1.23.4\src\sync\atomic\type.go:63:6: can inline atomic.(*Pointer[os.dirInfo]).CompareAndSwap with cost 70 as: method(*atomic.Pointer[os.dirInfo]) func(*os.dirInfo, *os.dirInfo) bool { return (*atomic.Pointer[go.shape.struct { os.mu sync.Mutex; os.buf *[]uint8; os.bufp int; os.h syscall.Handle; os.vol uint32; os.class uint32; os.path string }]).CompareAndSwap(atomic.x, &atomic..dict.Pointer[os.dirInfo], atomic.old, atomic.new) }
C:\Users\USER\go\go1.23.4\src\sync\atomic\type.go:60:6: can inline atomic.(*Pointer[os.dirInfo]).Swap with cost 68 as: method(*atomic.Pointer[os.dirInfo]) func(*os.dirInfo) *os.dirInfo { return (*atomic.Pointer[go.shape.struct { os.mu sync.Mutex; os.buf *[]uint8; os.bufp int; os.h syscall.Handle; os.vol uint32; os.class uint32; os.path string }]).Swap(atomic.x, &atomic..dict.Pointer[os.dirInfo], atomic.new) }
C:\Users\USER\go\go1.23.4\src\sync\atomic\type.go:57:6: can inline atomic.(*Pointer[os.dirInfo]).Store with cost 66 as: method(*atomic.Pointer[os.dirInfo]) func(*os.dirInfo) { (*atomic.Pointer[go.shape.struct { os.mu sync.Mutex; os.buf *[]uint8; os.bufp int; os.h syscall.Handle; os.vol uint32; os.class uint32; os.path string }]).Store(atomic.x, &atomic..dict.Pointer[os.dirInfo], atomic.val) }
...
Benchmarking
위 방법들로 heap escapes 보는 방법은 다소 보기 힘들고, escapes to heap이 많아 보여도 실제로 발생하는 object 할당은 적을 수 있고 한 번 할당한 object를 계속 재활용할 수도 있는 등 실제하고 매칭이 안 되는 이슈가 존재합니다.
그래서 이때 벤치마크로 전체적인 속도를 테스트도 하고, 기능 단위 별로 분석을 진행해서 분석합니다.
즉 profiling을 통해 어디를 많이 쓰는 지는 알았으니, 직접적인 속도를 벤치마크로 보는 거죠.
사용 예제는 다음과 같습니다.
$ go test -bench=. -benchmem -benchtime=10s -cpuprofile=cpu.prof -memprofile=mem.prof -gcflags='-m'
# pprof.com
./main.go:16:6: can inline (*TestApp).Close
./main.go:34:6: can inline (*TestApp).OpenSingleFile
./main.go:39:6: can inline (*TestApp).OpenTenFiles
./main.go:60:2: can inline main.deferwrap1
C:\Users\USER\go\go1.23.4\src\sync\atomic\type.go:63:6: can inline atomic.(*Pointer[go.shape.struct { os.mu sync.Mutex; os.buf *[]uint8; os.bufp int; os.h syscall.Handle; os.vol uint32; os.class uint32; os.path string }]).CompareAndSwap
C:\Users\USER\go\go1.23.4\src\sync\atomic\type.go:60:6: can inline atomic.(*Pointer[go.shape.struct { os.mu sync.Mutex; os.buf *[]uint8; os.bufp int; os.h syscall.Handle; os.vol uint32; os.class uint32; os.path string }]).Swap
C:\Users\USER\go\go1.23.4\src\sync\atomic\type.go:57:6: can inline atomic.(*Pointer[go.shape.struct { os.mu sync.Mutex; os.buf *[]uint8; os.bufp int; os.h syscall.Handle; os.vol uint32; os.class uint32; os.path string }]).Store
C:\Users\USER\go\go1.23.4\src\sync\atomic\type.go:54:6: can inline atomic.(*Pointer[go.shape.struct { os.mu sync.Mutex; os.buf *[]uint8; os.bufp int; os.h syscall.Handle; os.vol uint32; os.class uint32; os.path string }]).Load
C:\Users\USER\go\go1.23.4\src\sync\atomic\type.go:63:6: can inline atomic.(*Pointer[os.dirInfo]).CompareAndSwap
C:\Users\USER\go\go1.23.4\src\sync\atomic\type.go:60:6: can inline atomic.(*Pointer[os.dirInfo]).Swap
C:\Users\USER\go\go1.23.4\src\sync\atomic\type.go:57:6: can inline atomic.(*Pointer[os.dirInfo]).Store
C:\Users\USER\go\go1.23.4\src\sync\atomic\type.go:54:6: can inline atomic.(*Pointer[os.dirInfo]).Load
./main.go:27:13: inlining call to log.Printf
./main.go:66:17: inlining call to (*TestApp).OpenTenFiles
./main.go:67:10: inlining call to (*TestApp).Close
./main.go:75:18: inlining call to (*TestApp).OpenSingleFile
./main.go:76:16: inlining call to (*TestApp).OpenTenFiles
./main.go:60:15: inlining call to (*TestApp).Close
C:\Users\USER\go\go1.23.4\src\sync\atomic\type.go:63:6: inlining call to atomic.(*Pointer[go.shape.struct { os.mu sync.Mutex; os.buf *[]uint8; os.bufp int; os.h syscall.Handle; os.vol uint32; os.class uint32; os.path string }]).CompareAndSwap
C:\Users\USER\go\go1.23.4\src\sync\atomic\type.go:60:6: inlining call to atomic.(*Pointer[go.shape.struct { os.mu sync.Mutex; os.buf *[]uint8; os.bufp int; os.h syscall.Handle; os.vol uint32; os.class uint32; os.path string }]).Swap
C:\Users\USER\go\go1.23.4\src\sync\atomic\type.go:57:6: inlining call to atomic.(*Pointer[go.shape.struct { os.mu sync.Mutex; os.buf *[]uint8; os.bufp int; os.h syscall.Handle; os.vol uint32; os.class uint32; os.path string }]).Store
C:\Users\USER\go\go1.23.4\src\sync\atomic\type.go:54:6: inlining call to atomic.(*Pointer[go.shape.struct { os.mu sync.Mutex; os.buf *[]uint8; os.bufp int; os.h syscall.Handle; os.vol uint32; os.class uint32; os.path string }]).Load
./main.go:51:18: inlining call to (*TestApp).OpenTenFiles
./main.go:52:11: inlining call to sync.(*WaitGroup).Done
./main.go:20:10: (*TestApp).Close ignoring self-assignment in a.files = a.files[:0]
./main.go:16:7: leaking param content: a
./main.go:24:7: leaking param content: a
./main.go:24:24: leaking param: name
C:\Users\USER\go\go1.23.4\src\log\log.go:397:24: leaking param: b to result ~r0 level=0
./main.go:27:13: ... argument does not escape
./main.go:27:13: func literal does not escape
./main.go:34:7: leaking param content: a
./main.go:34:34: leaking param: name
./main.go:39:7: leaking param content: a
./main.go:39:32: leaking param: name
./main.go:46:7: leaking param: a
./main.go:46:44: leaking param: name
./main.go:47:2: moved to heap: wg
./main.go:50:6: func literal escapes to heap
./main.go:60:15: main.deferwrap1 ignoring self-assignment in a.files = a.files[:0]
./main.go:67:10: main ignoring self-assignment in a.files = a.files[:0]
./main.go:59:7: &TestApp{} escapes to heap
./main.go:81:12: ... argument does not escape
? pprof.com [no test files]- -benchmem : 한 번의 bench loop에서 메모리 할당량을 측정
- -cpuprofile, -memprofile : 프로파일링 결과를 파일로 저장하여 Heap 할당 위치 확인 가능
- -gcflags=’-m’ : 위에서 나온 거와 같이 Heap 할당 발생 여부를 확인
Heap 할당 줄이는 Tip
애초에 힙에 할당되는 메모리를 줄이는 것도 좋습니다.
1) 비정형 인자(Avoid any, interface {})의 사용 최소화
아래 코드에서 j, k는 Heap 메모리에 할당됩니다.
fmt.Println, fmt.Printf와 같은 함수는 any 타입을 사용하기 때문에 타입 정보를 저장해야 해서 Heap 할당을 유발합니다.
package main
import "fmt"
func main() {
    i := 0
    j := i + 1  // j escapes to heap
    k := j + 1  // k escapes to heap
    fmt.Println(j)
    fmt.Printf("%d\n", k)
}
비정형 인자는 코드 가독성을 높여주지만, 성능이 중요한 경우 최소한으로 사용해야 합니다.
2) 효율적인 Logger 선택
Logging은 Heap 할당을 많이 유발할 수 있습니다.
- log.Println() : any를 사용해 무조건 Heap 할당 발생
- slog : 타입을 지정해도 내부적으로 Heap 할당 발생
- zap : Primitive 타입은 Stack에 할당하여 성능 향상
3) 포인터 사용 주의 (CallByValue 활용)
Golang에서는 포인터 변수를 사용하면 무조건 Heap 할당이 발생합니다. 작은 구조체라면 포인터 대신 값 복사를 사용하는 것이 더 효율적일 수 있습니다.
4) Slice 생성 시 Capacity 지정
s := make([]int, n, 1024) // Heap 할당 방지 가능Golang에서 capacity나 len을 명확히 지정하면 Heap 할당을 방지할 수 있습니다.
5) sync.Pool 활용
객체 할당을 줄이기 위해 sync.Pool을 사용할 수 있습니다, 하지만 Pool을 관리하는 연산이 추가된 무로 CPU 사용 증가량을 확인해줘야 합니다.
var pool = sync.Pool{
    New: func() any {
        res := make([]int, 256)
        return &res
    },
}
6) 최신 패키지 활용 (slices.SortFunc vs sort.Slice)
goLang은 빠르게 업데이트가 이루어지다 보니 버전마다 heap 할당이 다릅니다.
최신 버전에서는 이전에 heap을 할당하던 로직이었던 부분을 개선할 수 있으니 가능한 최신 패키지를 사용합시다.
참조
- [Go] pprof를 사용해 profiling을 해보자(부제: 당신은 서버 이상 원인을 어떻게 찾으시나요?)
- 프로파일링 적용기 - 당신의 Go 애플리케이션은 좀 더 나아질 수 있다
- [도서] Go 성능 최적화 가이드
'Go Lang > Study' 카테고리의 다른 글
| [GoLang] 시간 초과 로직 Context, 채널과 비교 (0) | 2025.02.25 |
|---|---|
| [GoLang] net/http에서 http 요청을 동시적으로 처리하는 이유 (0) | 2025.02.17 |
| [GoLang] Garbage Collector 개념 (0) | 2025.01.29 |
| [GoLang] 추상 팩토리 디자인 사용해보기 (1) | 2025.01.17 |
| [GoLang] GraphQL API 만들기 part 1 (라이브러리 탐색) (38) | 2024.03.01 |